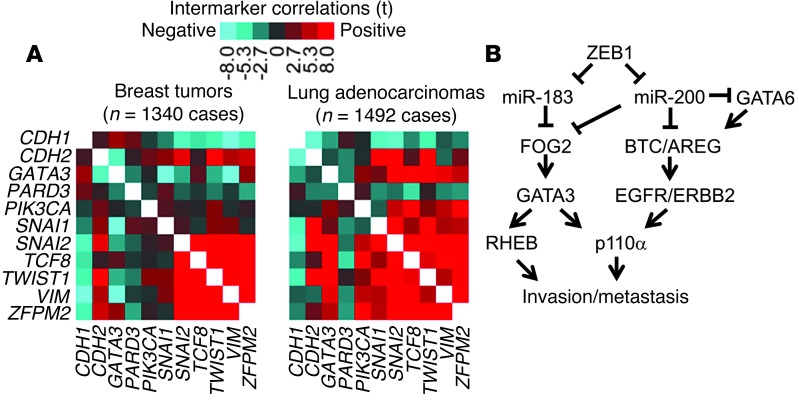
Figure 7. FOG2 expression was correlated with EMT.
(A) Heatmap depiction of correlations between selected genes and EMT status in breast and lung tumors. Two gene expression array datasets were examined, one from human breast cancer (n = 1340 tumors) and one from human lung adenocarcinoma (n = 1492 tumors). Each tumor profile was scored for the degree of EMT manifestation on the basis of a 16-gene signature of canonical EMT markers (CDH1, CDH2, DSP, FOXC2, FN1, ITGB6, MMP2, MMP3, MMP9, OCLN, SNAI2, SNAI1, SOX10, TWIST1, VIM, and GSC) (21). Tumors were scored by subtracting the sum of the normalized values for the epithelial markers from the sum of the values for the mesenchymal markers. Pearson’s correlations of genes with EMT scores are indicated. Red denotes a significant positive correlation; blue denotes a negative correlation. (B) Schematic illustration of the pathway described herein.

