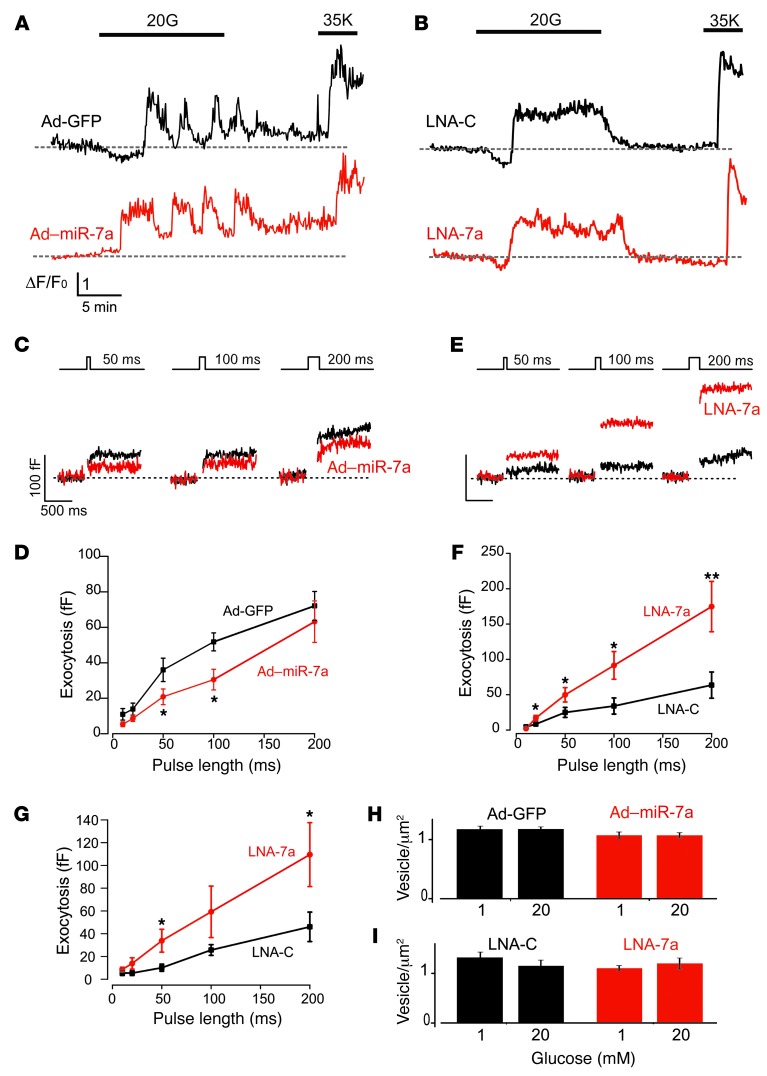
Figure 2. miR-7a controls exocytosis in primary pancreatic β cells.
(A and B) Calcium responses in (A) control (Ad-GFP) and miR-7a–overexpressing (Ad–miR-7a) and (B) control (LNA-C) and miR-7a–inhibited (LNA-7a) β cells under basal conditions and after addition of 20 mM glucose (20G) or 35 mM KCl (35K). Traces are representative of 40 (Ad-GFP), 22 (Ad–miR-7a), 14 (LNA-C), or 16 (LNA-7a) different cells from 3 different animals and expressed as ΔF/F0 (i.e., change relative to basal fluorescence [dashed horizontal lines]). (C and E) Exocytosis, monitored as increases in membrane capacitance, in (C) miR-7a–overexpressing and (E) miR-7a–inhibited β cells. Exocytosis was elicited by progressively longer (10–500 ms) depolarization from –70 to 0 mV (shown above traces). For clarity, only responses to 50-, 100-, and 200-ms depolarizations are shown. (D and F) Relationship between pulse duration and exocytosis (quantification of results in C and E, respectively). n = 14 (Ad–miR-7a2); 16 (Ad-GFP); 14–16 (LNA-7a and LNA-C). (G) As in F, but experiments were performed on human β cells (n = 18–20). (H and I) Docked granule density in (H) miR-7a–overexpressing and (I) miR-7a–inhibited cells. Data are from 15–23 cells obtained from 2 (H) or 3 (I) mice after a 15-minute incubation with 1 or 20 mM glucose. All data are mean ± SEM. *P < 0.05; **P < 0.01.

