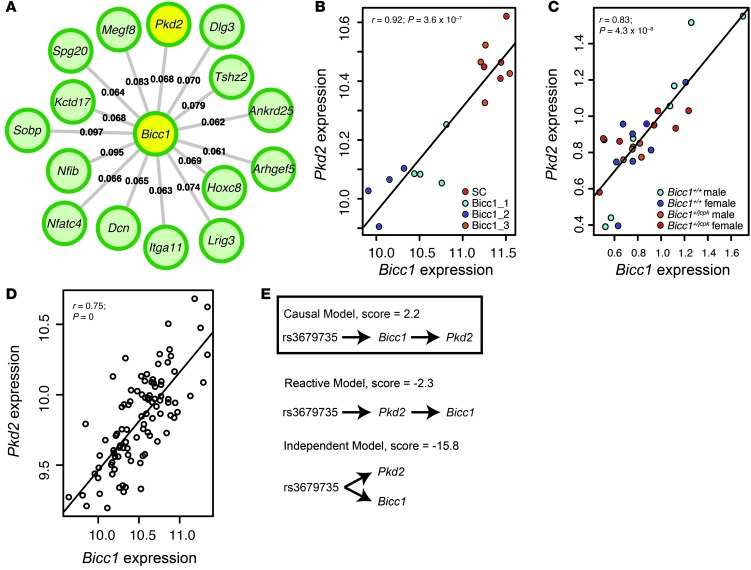
Figure 5. Network analysis and causality modeling identify Pkd2 as a putative downstream target of Bicc1.
Pkd2 was one of the top 15 M6 genes that was most strongly connected with Bicc1 (A). The connection strengths (TOMs, see Methods) are labeled for each Bicc1 gene connection. Pkd2 was the only gene identified from microarray analysis whose expression was significantly (FDR <0.05) correlated with Bicc1 knock down (B). Bicc1 and Pkd2 expression were correlated in osteoblasts isolated from individual Bicc1+/jcpk and Bicc1+/+ mice of both sexes (C). Bicc1 and Pkd2 expression were correlated in the HMDP bone samples (D). Causality modeling predicted that Bicc1 is upstream of Pkd2 (E).

