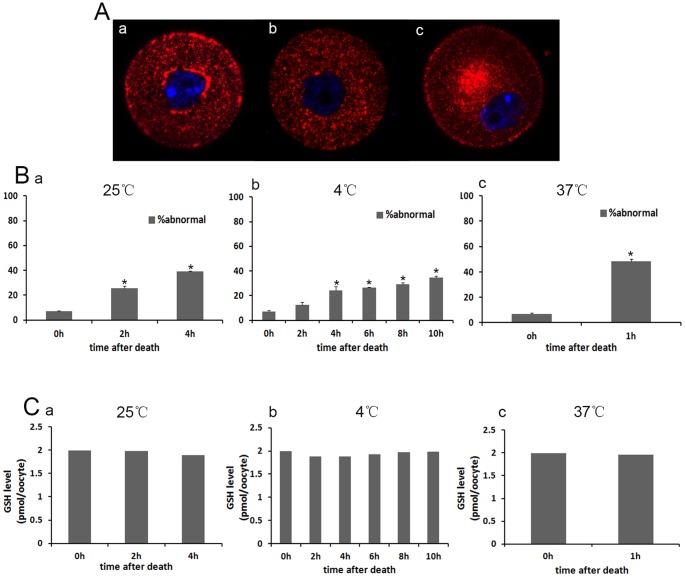
Figure 4. Effects of preservation time and temperature on mitochondrial distribution and GSH level in mouse oocytes.
(A) Mitochondrial distribution was evaluated by fluorescence microscopy. Three localization patterns were observed: perinuclear, homogenous and clustered. (B) The percentage of abnormal mitochondrial distribution in GV oocytes in the control group (n = 279) and preservation group at different temperatures. * indicate statistically significant differences (P<0.05). (C) The GSH concentrations in GV oocytes (n = 30) in different groups.

