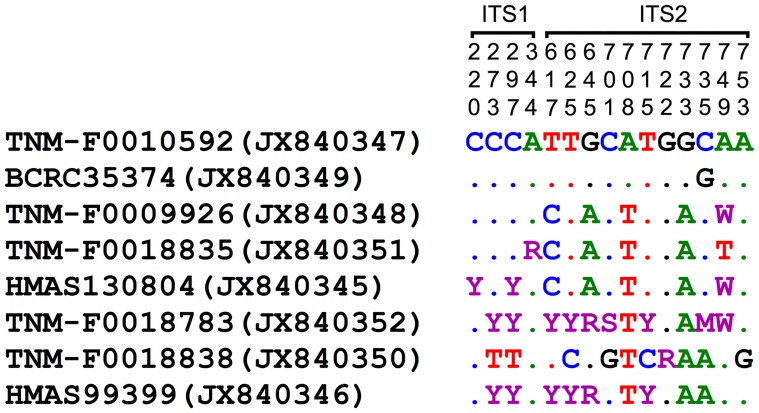
Figure 1. Variable sites in the ITS1 and ITS2 sequences of G. orbiforme from this study.
Nucleotide positions (top) correspond to positions in the original alignment matrix for the phylogenetic analysis. Specimen/strain nos of taxa follow from Table 1 and are listed on the left along with GenBank accession nos in parentheses. Dot stands for ‘identity’ to the reference sequence of TNM-F0010592. M, R, S, W and Y stand for ‘AC’, ‘AG’, ‘CG’, ‘AT’ and ‘CT’, respectively.

