
Figure 7. The number of causal SNPs with a significant P-value (<1×10⁻⁵) in the single-marker association test for different models of population history.
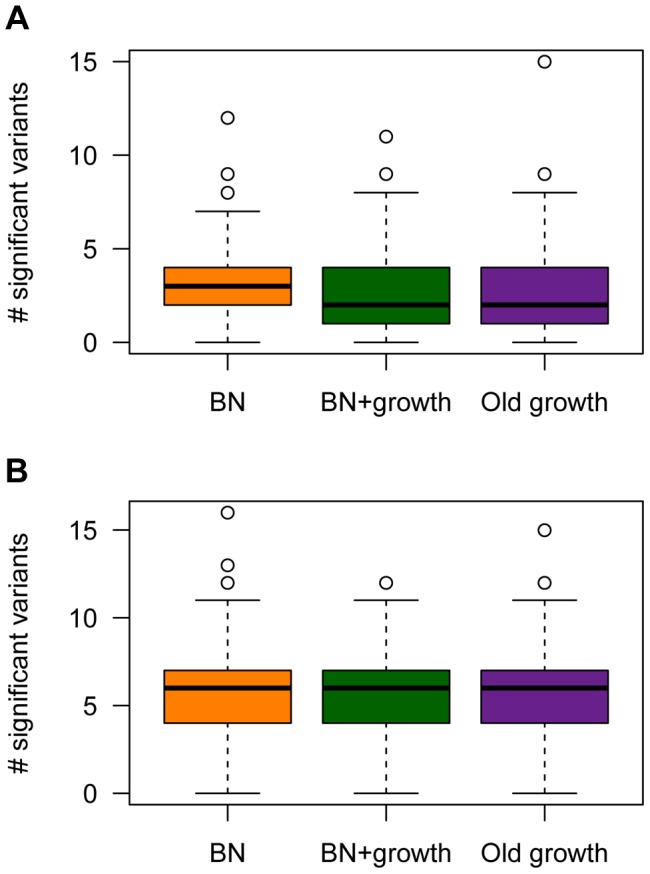
(A) A SNP's effect on the trait is correlated with its effect on fitness (τ = 0.5). (B) A SNP's effect on the trait is independent of its effect on fitness (τ = 0). Here  and M = 70 kb.