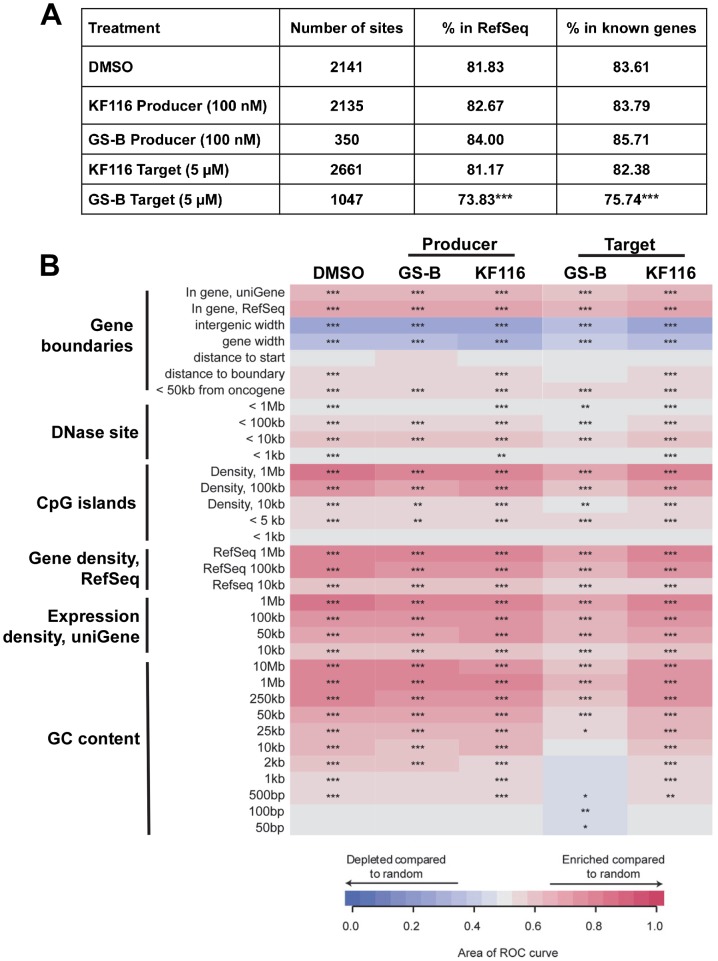
Figure 9. Effects of MINI KF116 and ALLINI GS-B on LEDGF/p75-dependent targeting of HIV-1 integration site distribution on chromatin.
(A) HIV-1 integration frequencies in RefSeq and known genes, comparing effects of KF116 and GS-B on LEDGF/p75-dependent targeting of HIV-1 integration. All the samples differed significantly from their respective matched random controls (using Fisher's exact test, P<0.001). Significant deviation from the control non-treated (DMSO) sample was calculated using Fisher's exact test and is denoted by asterisks (*** P<0.001). (B) Heatmap summarizing HIV-1 integration frequencies relative to the genomic features. The columns depict HIV-1 integration site data sets for the indicated drug treatments. For experiments involving the drug treatment of virus-producer cells (indicated “Producer”), the progeny virions were prepared in the presence of 0.1 µM KF116 or 0.1 µM GS-B and were then used to infect untreated target cells. For experiments involving the drug treatment of target cells (indicated “Target”), 5 µM KF116 or 5 µM GS-B inhibitor was added directly to the target cells and the cells were infected with untreated virions. The rows depict the analyzed genomic features and the base pair values shown in the rows indicate the size of a given genomic interval used for the analysis. The relationship between HIV-1 integration site frequencies relative to matched random controls for each of the genomic feature was quantified using the receiver operator characteristic (ROC) curve area method. The color key shows enrichment (indicated in red) or depletion (indicated in blue) of a given genomic feature near integration sites. P values were calculated for the individual integration site data sets compared to the matched random controls, ***P<0.001; **P<0.01; *P<0.05.

