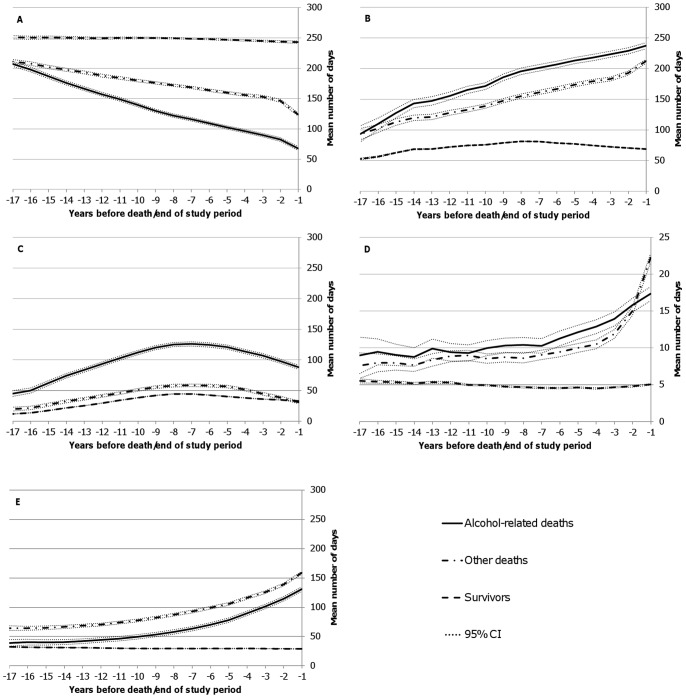
Figure 3. Average annual number of days of employment and non-employment.
Sex and age adjusted average annual number of days of A) employment, B) total non-employment, C) unemployment, D) medically certified sick leave, and E) disability pension in the preceding 17 years before death/end of study period for those who died of alcohol-related causes, other causes, and for those who survived the 17-year period.

