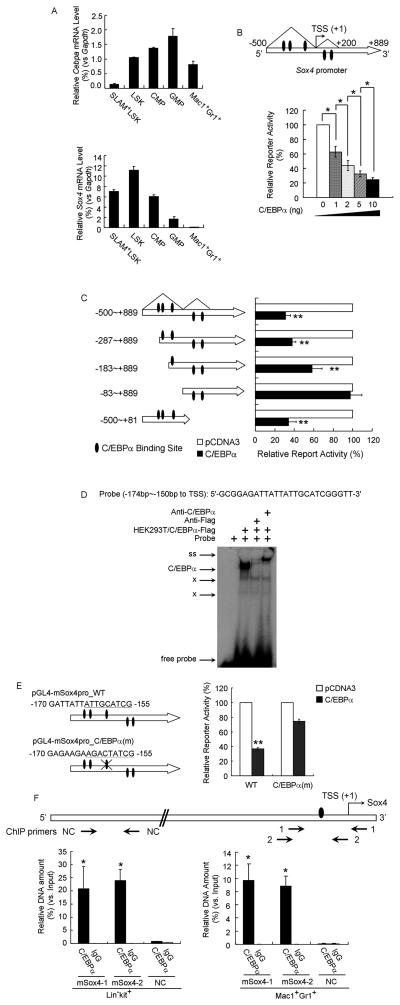
Figure 2. Sox4 is a direct target of repression by C/EBPα.
(A) qPCR analysis of Cebpa (top) and Sox4 (bottom) level in SLAM+-LSK, LSK, CMP, GMP and myeloid cells (Mac1+Gr1+). Relative gene expression levels were determined as % Gapdh.
(B) (Top) Schematic representation of the Sox4 promoter extending from −500bp to +889bp relative to TSS of murine Sox4 gene. Triangles denote the ChIP-Seq C/EBPα binding peaks as shown in Figure S2A. (Bottom) HEK293 cells were transfected with the Sox4 promoter reporter and increasing amounts of pCDNA3-C/EBPα. Luciferase activities were normalized to renilla activities and presented as percentage of empty vector.
(C) (Left) Schematic representation of truncated constructs of the Sox4 promoter reporter. (Right) Luciferase values of reporter constructs with an empty vector (white bar) or C/EBPα expressing constructs (black bars).
(D) EMSA using a probe containing a potential C/EBPα binding site from the Sox4 promoter was performed with nuclear extracts from HEK293T cells overexpressing Flag tagged C/EBPα (HEK293T/C/EBPα-Flag) and Flag antibody (anti-Flag) or C/EBPa antibody (anti-C/EBPα). “C/EBPα”, C/EBPα complex; ss, supershifted band; x, migration of nonspecific protein complexes binding to the probes.
(E) (Left) Schematic representation of luciferase reporters carrying wild-type Sox4 promoter (WT) or Sox4 promoter with mutated C/EBPα binding sites (C/EBPα(m)) marked with a cross. The putative C/EBPα binding sites and the mutated version are underlined. (Right) Luciferase values of reporter constructs carrying wild-type or site-mutated Sox4 promoter with an empty vector (white bar) or C/EBPα expressing constructs (black bars).
(F) ChIP-qPCR analysis of specific binding of C/EBPα to the upstream proximal region of murine Sox4 gene in wild-type primary stem/progenitor cells (Lin−c-kit+) or myeloid cells (Mac1+Gr1+). (Top) Schematic of Sox4 gene with three qPCR primer sets (arrows below). Oval denotes the C/EBPα binding site identified in Figure 2E. Primer sets “mSox4-1” and “mSox4-2” were used to amplify regions −171 to +77 bp and −215 to −16 bp (relative to the TSS) of Sox4 gene and primer set “NC” were used as a negative control. (Bottom) Relative DNA enrichment was measured by qPCR and is presented as percentage of input chromatin. Black bars represent ChIP-qPCR signals from the C/EBPα pull-down (C/EBPα) while white bars are from IgG control (IgG).
Error bars indicate the mean ± SEM of 3 independent experiments. *: p<0.01; **: p<0.001. See also Figure S2.

