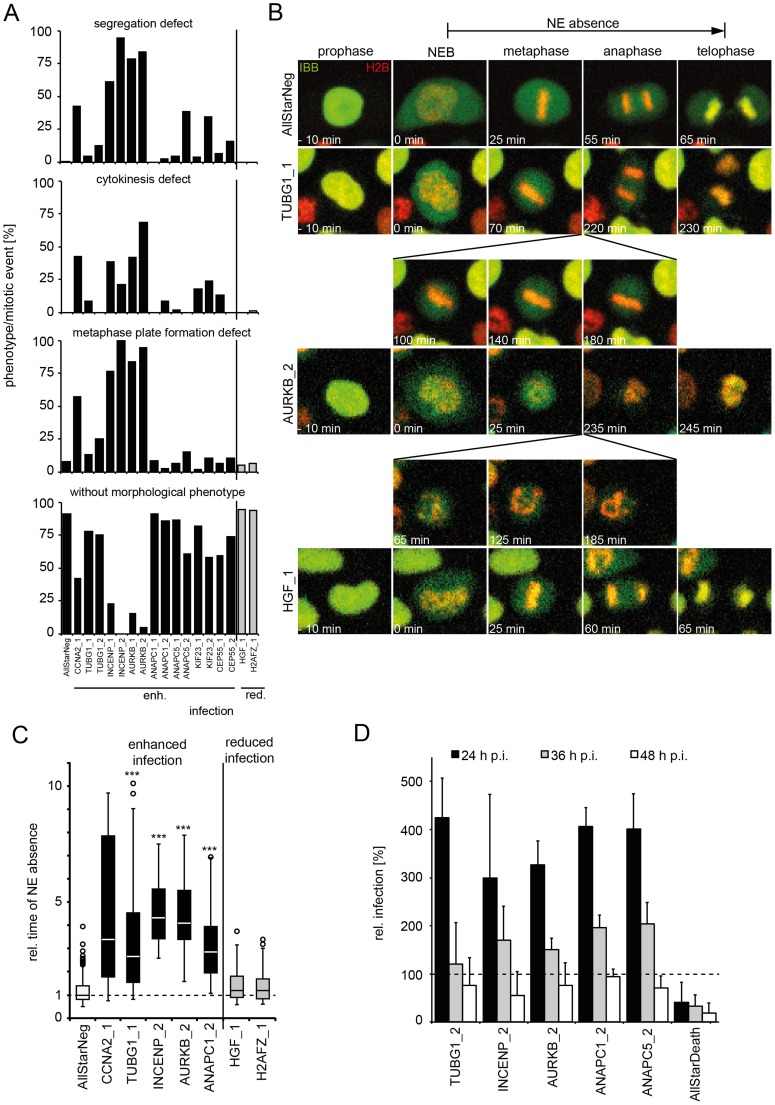
Figure 6. Mitotic regulators that enhance HPV16 infection exhibit prolonged mitoses upon RNAi.
HeLa H2B-mRFP/IBB-GFP cells were reverse transfected with the indicated siRNAs (see also Table S4). (A) Cells were imaged by video microscopy 48 h post transfection for 24 h in 5 min intervals. Mitotic events after RNAi were assigned to one or more morphological phenotypes such as defects in metaphase plate formation, chromosome segregation, cytokinesis, or designated without morphological phenotype (from top to bottom). (B) Time-lapse images of representative cells from (A). Mitotic progression is depicted for cells after RNAi of TUBG1 (2nd row, see Video S11), AURKB (3rd row, see Video S12), HGF (4th row, see Video S13) or control (AllStar Neg., 1st row, see Video S10). (C) The timing from NEB until telophase (i.e. nuclear accumulation of IBB-GFP) was used to define the time of NE absence. Relative times of NE absence are presented as boxplots with outliers (circles). Statistical significance was determined by a one-tailed, independent, heteroscedastic t-test; ***: p-value <0.001. (D) 48 h after reverse transfection of indicated siRNAs, cells were infected with HPV16-GFP, and infection was scored at 24 h, 36 h, and 48 hpi by automated microscopy and computational image analysis. Depicted is the infection relative to AllStarNeg control in percent ± SD.

