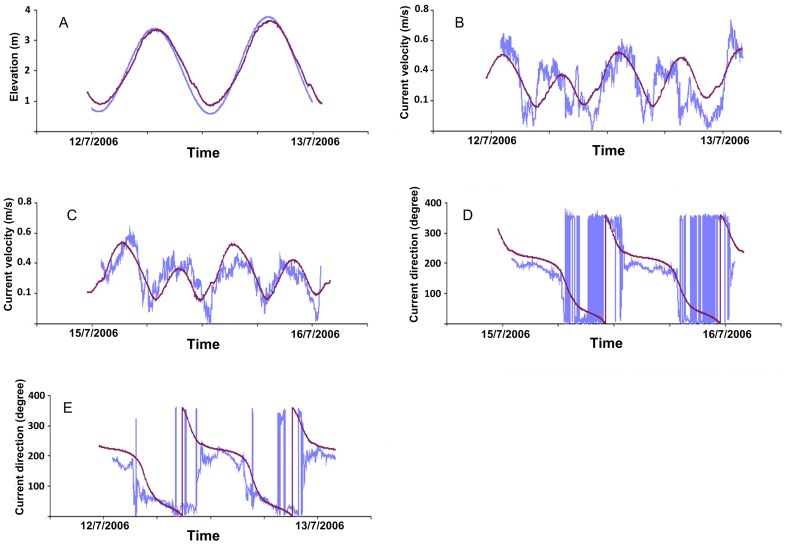
Figure 3. Model validation.
The modelled hydrographic parameters were derived for two sampling stations within the reef complex and were recorded for model runs 15 days in duration (6/07/06 to 21/07/06). Time series of the intensity and current direction (blue line) and modelled (dark line) of one day at two stations St1 (B,E) and St2 (C,D) at the bottom and elevation measurements (A).

