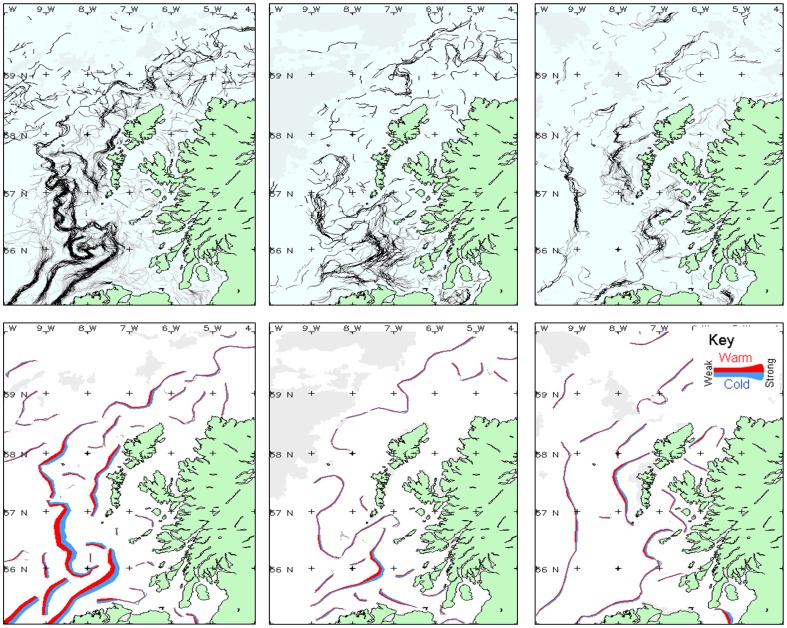
Figure 7. Remote Sensing I. Thermal fronts in several months in 2010.
Thermal fronts observed during selected months in 2010. Left column: March; center column: May; right column: December. The upper maps show the composite front map derived from all cloud-free observations during that month; whereas the lower maps depicts a simplified version of the fronts, coloured red-blue to indicate the warm-cold side of the front, and the thickness of the line indicates the strength of the front.

