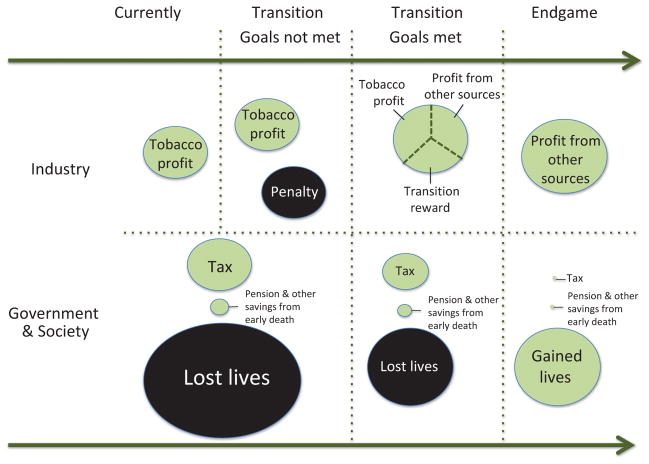
Figure 1.
The big picture of profits and losses in current, transition and endgame settings: The figure shows the process where the tobacco industry is either rewarded or penalized for scheduled goals towards eliminating tobacco products. Gains (marked in green) and losses (marked in black) are shown separately for the industry and for the government/ society. The size of the circles is proportional to the amount of money involved and represents a typical scenario. The two scenarios in the transition phase correspond to the situations where self-elimination goals are met or not met, respectively.

