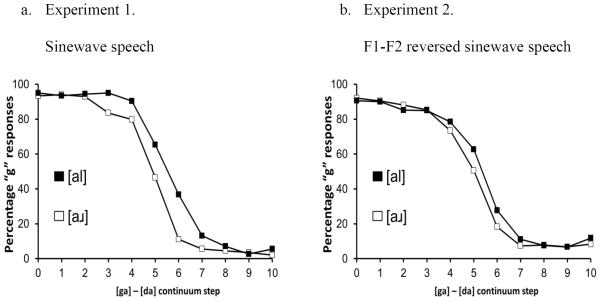
Figure 2.
A comparison of the effects of sinewave precursors (Experiment 1 in panel A) and selectively-reversed sinewave precursors (Experiment 2 in panel B). Whereas sinewave precursors produce strong (average mean difference across conditions = 7.43%, p < .0001), the precursor conditions are not reliably different in Experiment 2 (average mean difference across conditions = 2.57%, p = 0.21). The weak trends noticeable between continuum steps 4 through 7 maybe explained due to the masking produced by the concentration of energy in F3 (see Figure 3).

