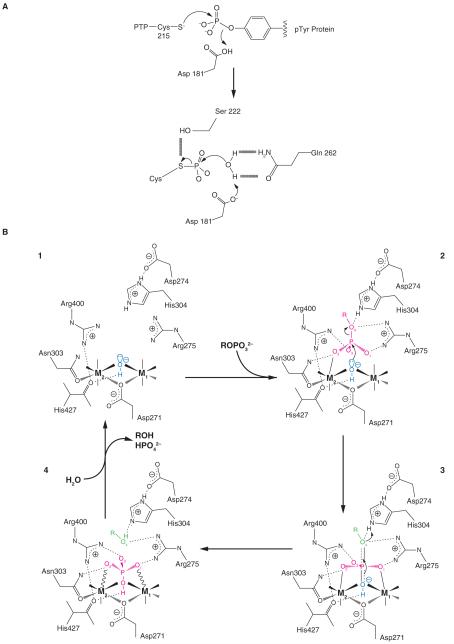
Figure 2. Comparison of PTPase and PPP- catalytic mechanism.
A) Schematic representation of PTP-Cys-mediated hydrolysis of substrate derived from the crystal structure of PTP1B (Barford, et al. 1994). Schematic representation of metal ion-mediated hydrolysis of substrate derived from the crystal structure of PP5C (Swingle et al. 2004). The attacking hydroxide W1 is shown in blue, and the leaving group of the substrate is in green. The substrate, the planar PO3 moiety of the transition state, and the phosphate product are all shown in red. Solid lines to the metal ions denote metal-ligand bonds, and solid or dashed wedges indicate metal-ligand bonds directed above or below the plane of the page, respectively. Wavy lines to the metal ions indicate strained contacts with poor coordination geometry. Dotted lines indicate hydrogen bonds, and the nearly dissociated axial bonds in the transition state are shown by half-dotted double lines.

