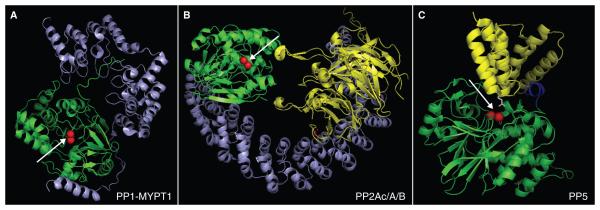
Figure 4. Structural comparison of PP1-MYTP1, PP2Ac-A-B and PP.

A) PP1 (green) in complex with myosin phosphatase targeting subunit MYPT1 (blue). B) PP2A holoenzyme: PP2A catalytic subunit (green) in complex with the PP2A scaffold A (blue) and a B55-regulatory targeting subunit (yellow). C). PP5 in an inactive conformation. The catalytic domain is shown ingreen, N-terminal inhibitory/TPR-targeting domain in yellow, and a unique C-terminal inhibitory domain in blue. The images were generated using PyMol based on protein data bank accession number 1S70 (Terrak, et al. 2004) (PP1-MYTP1), 3DW8 (Xu, et al. 2008) (PP2Ac/A/B) and 1WA0 (Yang et al. 2005) (PP5). Arrows indicate the catalytic site with metal ions shown as red spheres.
