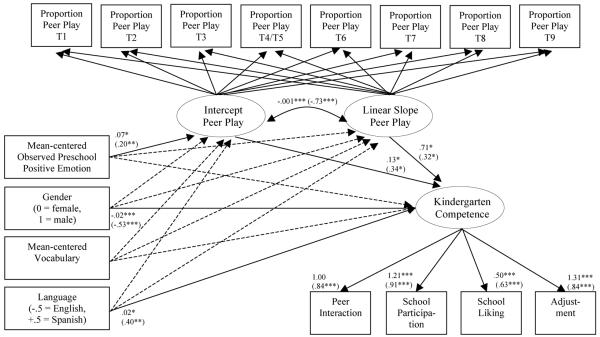
Figure 2.
Latent growth model analysis for peer play predicting kindergarten competence. Loadings for the intercept factor were set at 1.0 for all indicators. Loadings for the linear slope factor were set at 0, 1, 2, 3.5, 5, 6, 7, and 8 for T1, T2, T3, T4/T5, T6, T7, T8, and T9 indicators, respectively. For clarity, non-significant path estimates are not reported. Significant unstandardized estimates and associated significance levels are presented. Significant standardized estimates and associated significance levels are presented in parentheses (completely standardized estimates for continuous predictors and standardized only on Y estimates for categorical predictors). Covariates freely correlate. The correlations between the residuals for T3 and T4/5, and for T6 and T7 peer play were positive and statistically significant, p < .001 (not included in the figure for clarity). *p < .05. **p < .01. ***p < .001.

