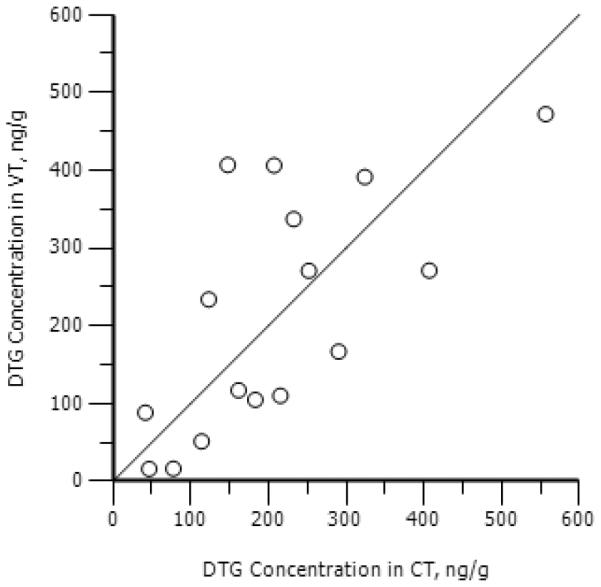
Figure 3. The correlation between cervical tissue (CT) and vaginal tissue (VT) dolutegravir (DTG) concentrations.

Individual concentration/time points are plotted for DTG in CT and VT. A significant (p=0.003) correlation is noted between CT and VT concentrations (rho=0.70). A line of unity is presented as reference.
