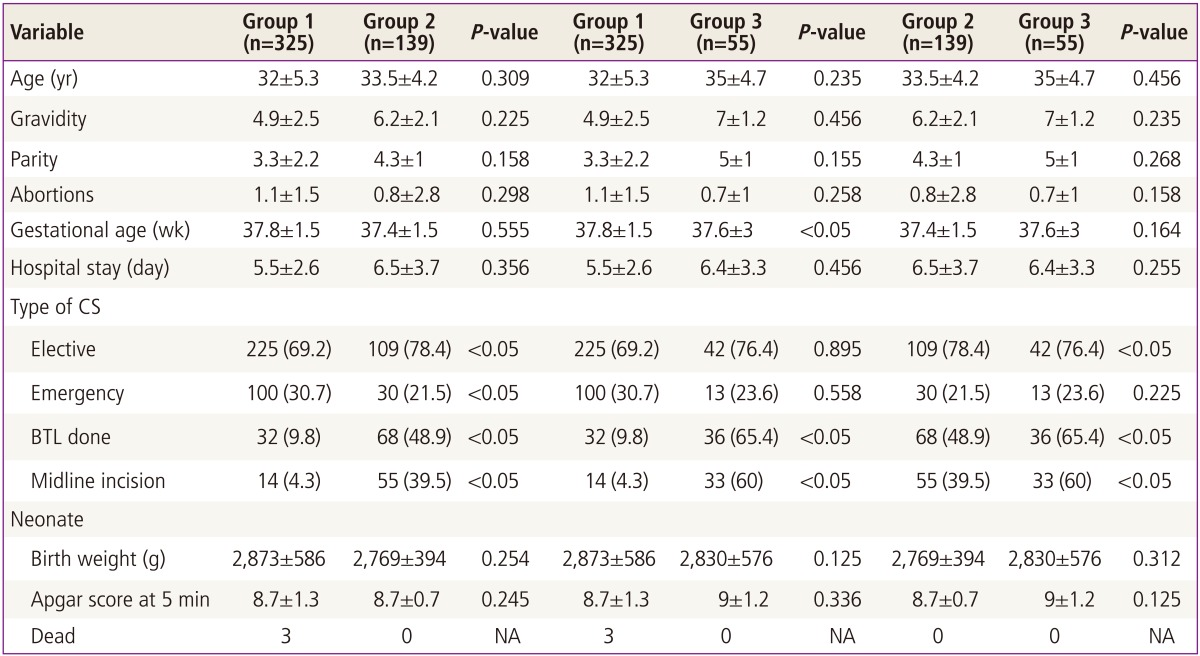
Table 1.
Demographics and clinical features of patients

Values are presented as mean±SD, number (%), or number unless otherwise indicated; Group 1=previous 3 CS, group 2=previous 4 CS, group 3=previous ≥5 CS; Significant P-value <0.05.
CS, cesarean section; BTL, bilateral tubal ligation; NA, not applicable.
