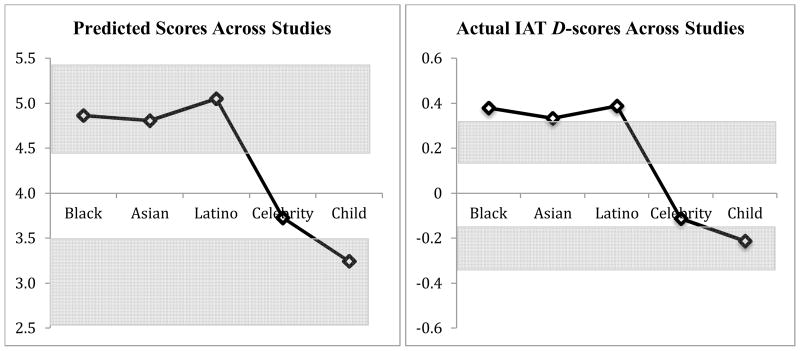
Figure 5.
Average IAT score predictions (1–7 scale) and average actual IAT D scores across all four studies. Shaded areas represent the areas in which an implicit attitude would be labeled as “slightly more positive” on the predictions scales or as a “slight preference” according to conventions from the IAT webpage (www.projectimplicit.com, Nosek et al. 2006, personal communication from N. Sriram to I. Blair on July 6, 2009).

