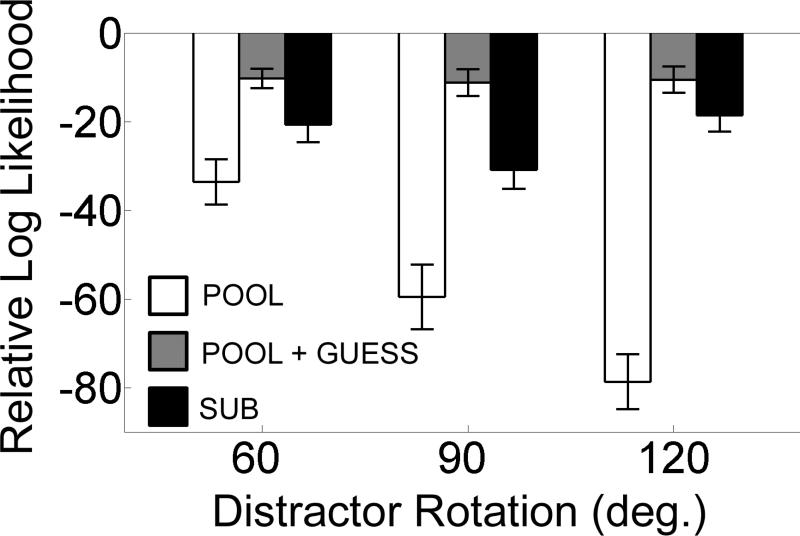
Figure 4. Bayesian Model Comparison – Experiment 1.
Mean (±1 S.E.M.) log-likelihood values for the POOL (Eq. 1), POOL+GUESS (Eq. 3), and SUB (Eq. 2) models are plotted relative to the SUB+GUESS model. A negative log-likelihood value, x, means that the data are ex times more likely under the SUB+GUESS model.

