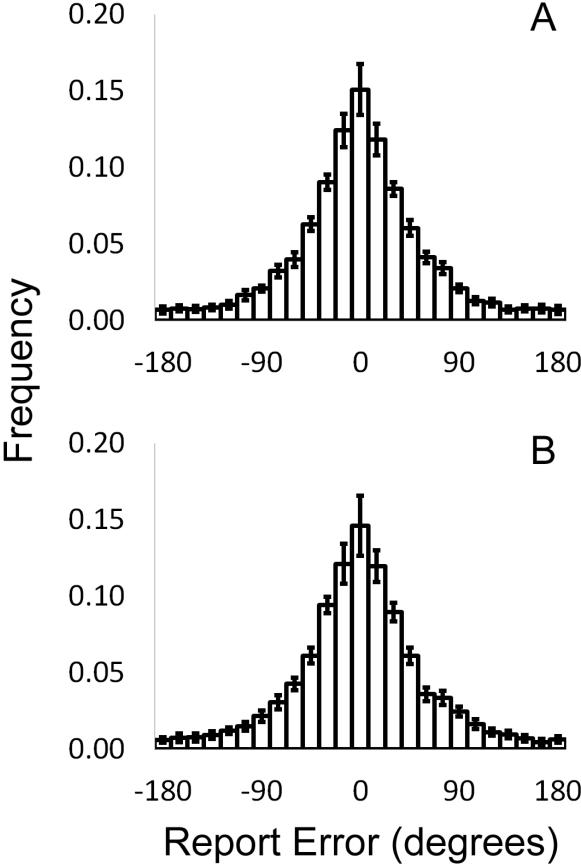
Figure 8. Task Performance in Experiment 4.
Panels A and B depict the mean (±1 S.E.M.) histogram of report errors (bin width = 14.4°) relative to the mean orientation of the center and flanker items during near (A) and far (B) trials. Both distributions are unimodal, suggesting that observers could in fact access, compute, and report the mean orientation of each display. Moreover, this ability was unaffected by strong manipulations of crowding strength, replicating earlier findings (e.g., Solomon et al., 2010).

