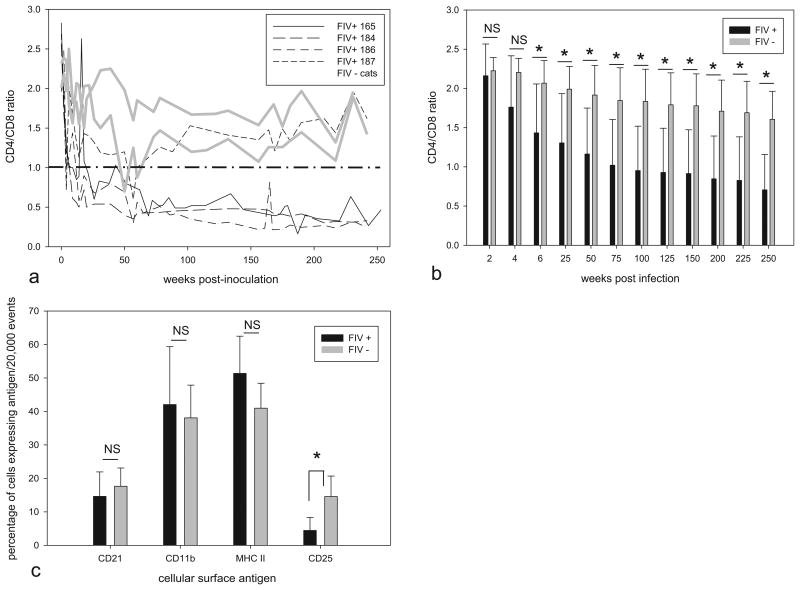
Fig. 2.
CD4/CD8 ratios and leukocyte subsets. (a) CD4/CD8 T-cell ratios were determined by flow cytometry in 4 FIV C-infected and 2 mock-infected cats over the first 253 weeks PI. Individual animals are represented by dashed black lines (FIV+ cats 165, 184, 186, and 197) or solid gray lines (uninfected control cats 183 and 185). (b) Cumulative CD4/CD8 T-cell ratios for FIV-infected (black bars) and uninfected (gray bars) cats from 2 to 250 weeks post-infection. For infected vs. uninfected animals, the ratios are not significantly different (NS) for 2 and 4 weeks post-infection. Infected animals have reduced ratios relative to controls for ratios 6 weeks post-infection and greater (*p < .05). (c) Percentage of peripheral leukocytes expressing the cell surface antigens CD21, CD11b, MHC II, and CD25 assessed by flow cytometry at 4 time points for the infected (black bars) and uninfected (gray bars) cats during the chronic phase of FIV infection (175–253 weeks PI). The percentage of CD25 cells in infected cats was less than uninfected control cats, respectively (*p < 0.05). Statistical significance is denoted by an asterisk for selected pair wise comparisons (*p < 0.05); error bars denote standard deviation. No difference in the percentage of CD21, CD11b and MHC II cells was identified between infected and uninfected cats (NS, not significant).

