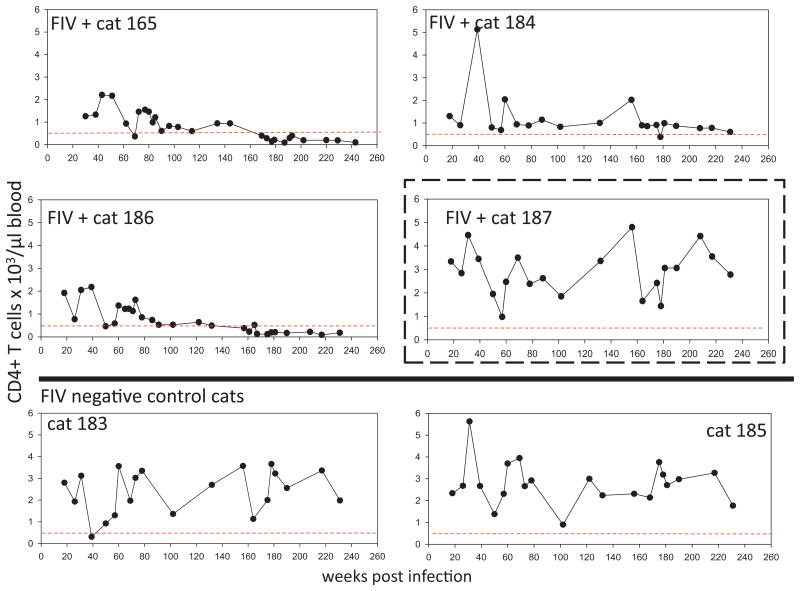
Fig. 3.
CD4 T cell counts. Total number of peripheral CD4T cells over the first 240 weeks post-inoculation in 4 FIV-infected cats (165, 184, 186 and 187) and 2 mock-infected cats (183 and 185) as determined by flow cytometry. For each graph, a dotted line is shown at ∼500cells/μl blood, the lower boundary limit for normal adult cats (Dean et al., 1991). A dashed box is drawn around the data for FIV-infected animal 187, who demonstrates a persistently normal CD4/CD8 ratio.

