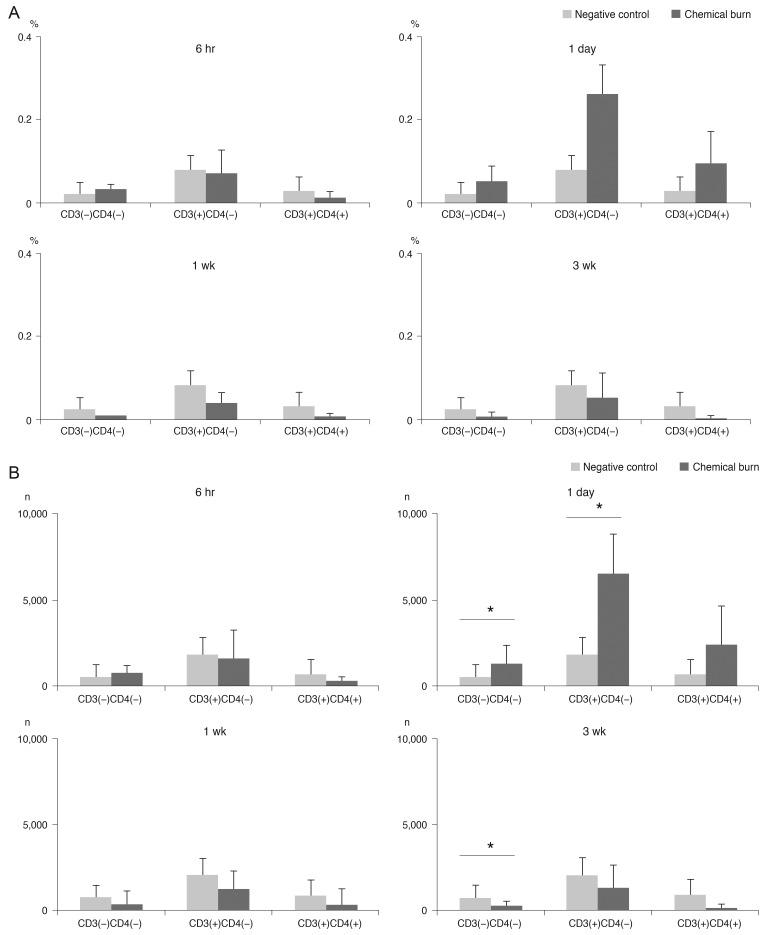
Fig. 3.
The bar charts show the mean (A) percentages and (B) cell numbers of the interferon gamma (IFN-γ) secreting cells in the cervical lymph nodes of the 4 groups (each group, n = 5), divided over the time course of 6 hours, 1 day, 1 week, and 3 weeks after the onset of chemical injury. Note that IFN-γ-secreting non-Th-cells (CD3(-)CD4(-) T-cells) reached the highest peak at day 1 after injury, and the Th-cells also increased at 1 day before the levels returned to baseline. *p < 0.05 (Moses extreem reactions test).

