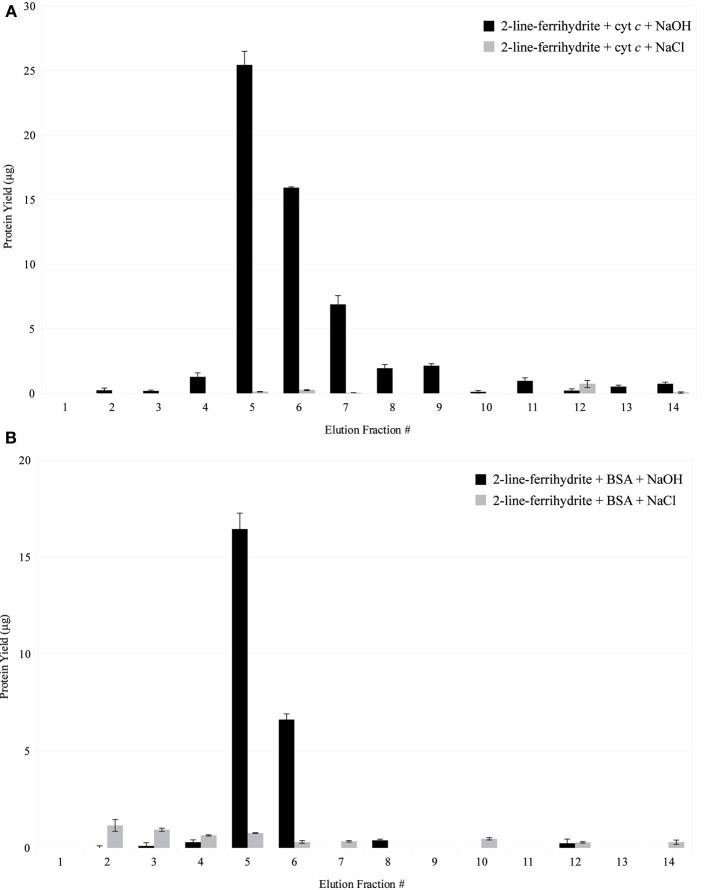
Figure 11.
(A) Interaction of cytochrome c with synthetic iron oxyhydroxide. Fractions 1–4 were eluted in 20 mM sodium acetate buffer, pH 5.25. Fractions 5–14 were eluted in 0.1 N NaOH or 1 M NaCl. Error bars indicate ± one standard deviation from the mean. (B) Interaction of BSA with synthetic iron oxyhydroxide. Fractions 1–4 were eluted in 20 mM Tris buffer, pH 8.00. Fractions 5–14 were eluted in 0.1 N NaOH or 1 M NaCl. Error bars indicate ± one standard deviation from the mean.

