
Figure.
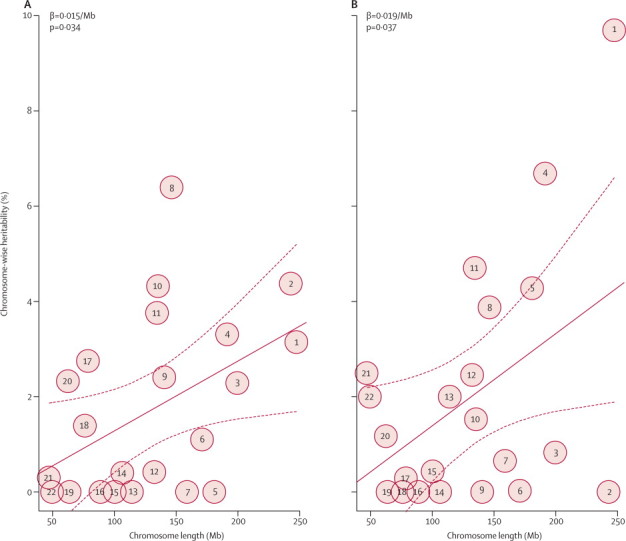
Chromosome-wise heritability estimation for glycaemic response to metformin
Chromosome-wise heritability plotted for whether or not the target of on-treatment HbA1c<7% (53 mmol/mol) was achieved (A), and for model-adjusted reduction in HbA1c—ie, residuals of absolute reduction adjusted by known clinical covariates (B). The circled numbers show the heritability point estimates of each chromosome (sex chromosomes were not included). The solid lines plot the linear regression of chromosome-wise heritability against chromosome length; the dotted lines show 95% CI.