Figure 2.

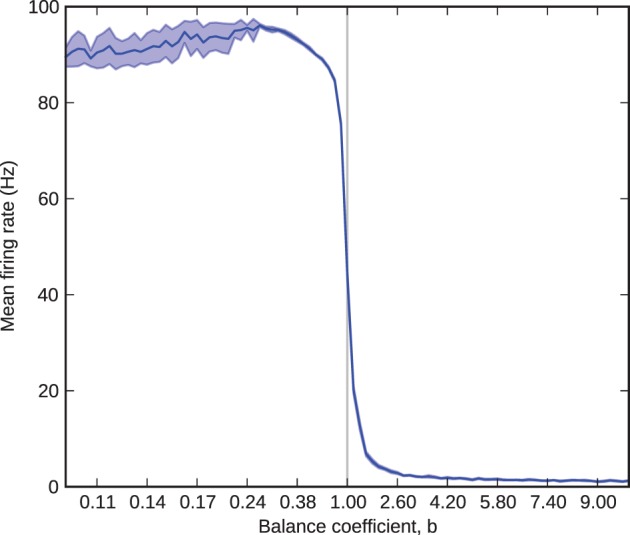
Barrel firing rate as a function of the balance coefficient, b. The solid blue line represents the 10-trial mean and the shaded area represents one standard deviation over the same 10 trials.

Barrel firing rate as a function of the balance coefficient, b. The solid blue line represents the 10-trial mean and the shaded area represents one standard deviation over the same 10 trials.