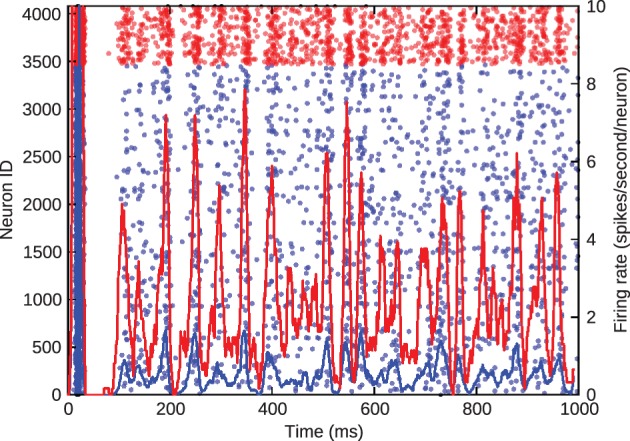
Figure 3.

Asynchronous, irregular spiking in the barrel model. Blue represents excitatory neurons and red represents inhibitory neurons. The left y-axis gives the ID of the spiking neurons in the scatter plot. The right y-axis gives the average firing rate of the excitatory and inhibitory populations, denoted by the solid lines.
