Figure 5.

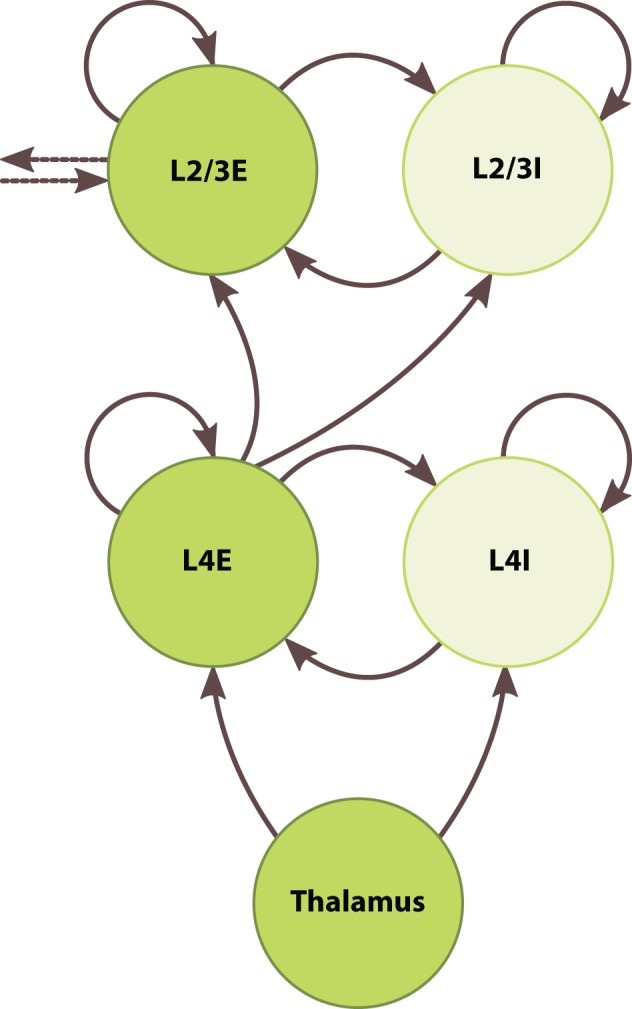
Architecture of the barrel-column model. Circles represent discrete populations. Solid and dotted arrows represent intra- and interbarrel synaptic projections, respectively.

Architecture of the barrel-column model. Circles represent discrete populations. Solid and dotted arrows represent intra- and interbarrel synaptic projections, respectively.