
Figure 3.
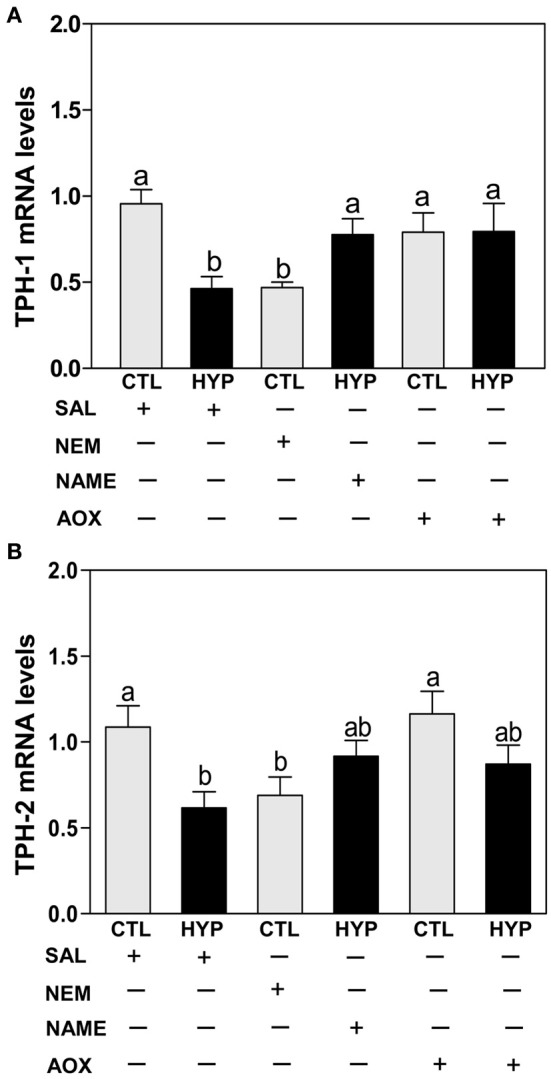
Interactive effects of hypoxia and pharmacological agents that modulate generation of ROS and RNS on TPHs mRNA expression determined by quantitative real-time PCR in croaker hypothalamus. Effects of hypoxia (DO: 1.7 mg/L for 4 weeks) exposure and pharmacological treatments with NEM, NAME, and AOX on expression of TPH-1 (A) and TPH-2 (B) mRNA levels in croaker hypothalamus. Each bar represents mean ±s.e.m. (N = 9–12, results from both sexes were combined because they were not significantly different). Fisher's PLSD, are indicated with different letters (P < 0.05). SAL, saline; CTL, control; HYP, hypoxia.