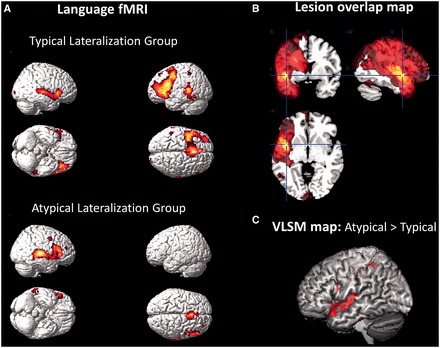
Figure 2.

(A) Group functional MRI maps of patients with typical (left-sided, n = 32) and atypical (right-sided and bilateral, n = 19) language activation. Maps are displayed at family-wise error corrected threshold of P = 0.05. (B) Lesion overlap map showing the distribution of left hemisphere lesions in the patient sample (scale ranges from 0–30% overlap). Most lesions clustered around the perisylvian region. (C) Voxel-based lesion-symptom (VLSM) map showing greater likelihood of lesion location in anterior temporal and inferior frontal regions in the atypical compared to typical lateralization group (Liebermeister statistic at false discovery rate at P < 0.05). Smaller clusters are visible in the posterior inferior frontal and inferior parietal regions.
