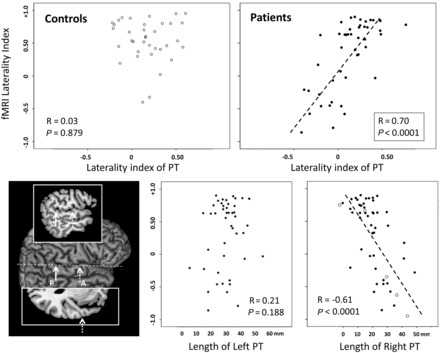
Figure 3.

Scatterplots showing distribution of functional MRI laterality indices in Broca’s regions in controls and patients against planum temporale (PT) laterality indices (top). The two graphs below show the functional MRI laterality against the length of the left and right planum temporale (adjusted for intracranial volume), separately, in the patient group. Cases in which the left planum temporale could not be determined due to lesions in the superior temporal lobe are shown with open symbols. The inset on the left shows the definition of the anterior (A) and posterior (P) borders of the planum temporale, shown on the surface rendering of the right side of the brain. Heschl’s sulcus defined the anterior border (shown on the axial slice inset above) and the posterior border was marked by the end of the horizontal portion of the sylvian fissure (shown on the sagittal slice inset below).
