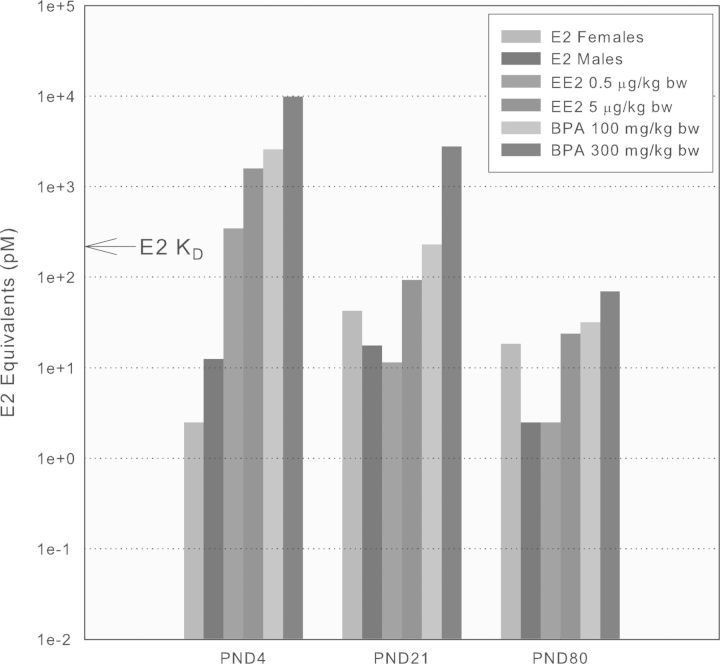
FIG. 7.
Comparison of estrogen receptor α (ERα) binding-equivalent serum concentrations of endogenous E2 with EE2- and BPA-treated rats of different ages (see the Results section for description of the process used). The combined male + female Cmax values for BPA in the 100,000 and 300,000 μg/kg bw treatment groups are shown along with combined Cmax values for both doses of EE2 and the endogenous E2 values obtained in either male or female pups at various life stages. The KD for E2 with ERα of 200pM is shown for reference.

