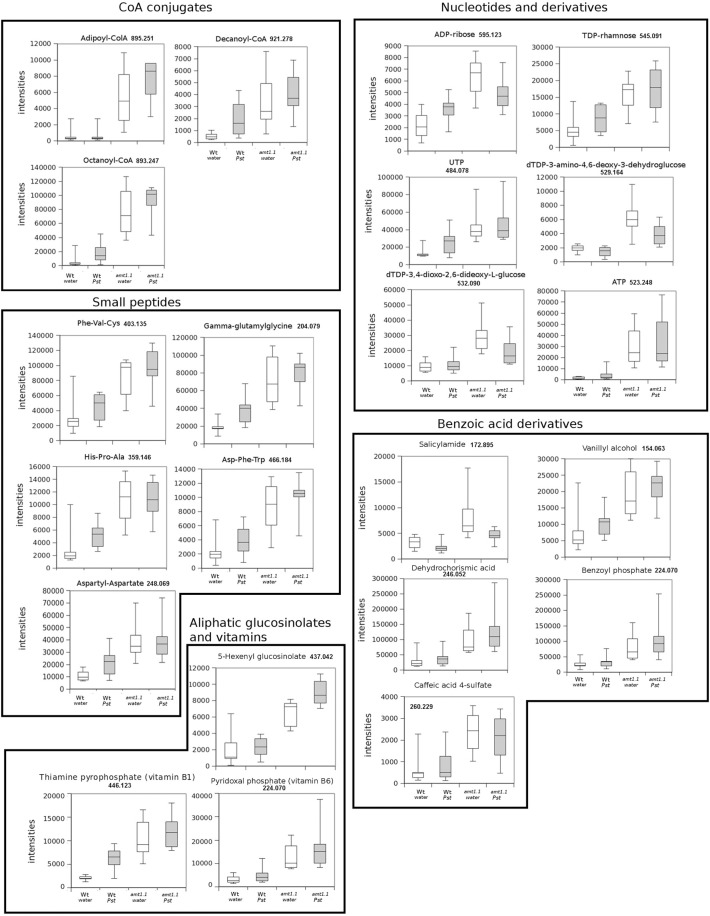
Figure 8.
Profiling of the main hits in the overaccumulated compounds upon P. syringae (Pst) infection in amt1.1 compared with Col3-gl1. Five week old Col3-gl1 and amt1.1 were infected as described in Figure 1. After 48 hpi plants were processed for relative quantification analysis by HPLC-QTOFMS data. The concentration of the metabolites was determined in all the samples by normalizing the chromatographic area for each compound with the dry weight of the corresponding sample. The compounds were tentatively identified using the exact mass criteria using the METLIN and Massbank databases. The compounds were grouped by metabolic pathways according to KEGG and AraCyc databases. White bars are mock inoculated and filled bars are P. syringae infected plants. Leaf material from 15 individual plants were pooled together for each treatment × genotype combination. Boxplots represent average three independent experiments with two technical replicates. Only data showing a p-value below 0.05 after a Kuskal Wallys test were used for pathway assignation (n = 6).

