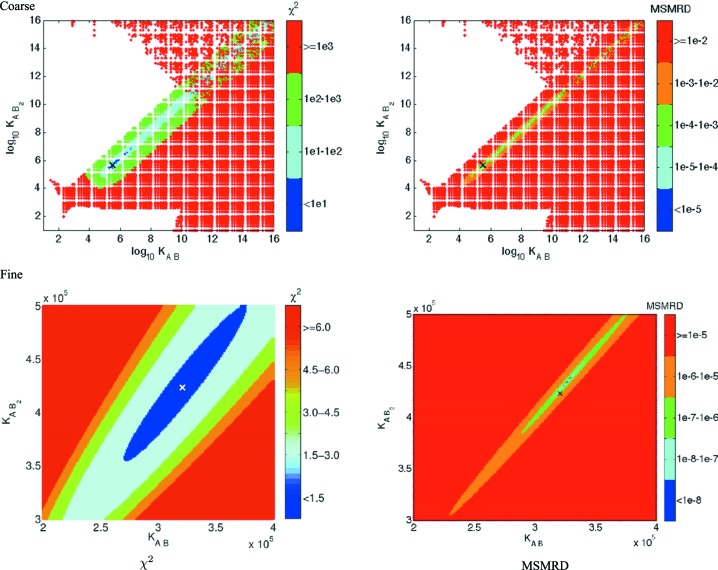
Figure 5.
Association constant searches for one BAF–emerin complex data set, for the correct A + B → AB, AB + B → AB 2 pathway. The ‘×’ marks indicate the simulated association constants (K AB = 3.21 × 10⁵, K AB2 = 4.23 × 10⁵). The white regions in the coarse-grid plots indicate constants yielding nonphysical scattering curves (those with substantial negative intensities).

