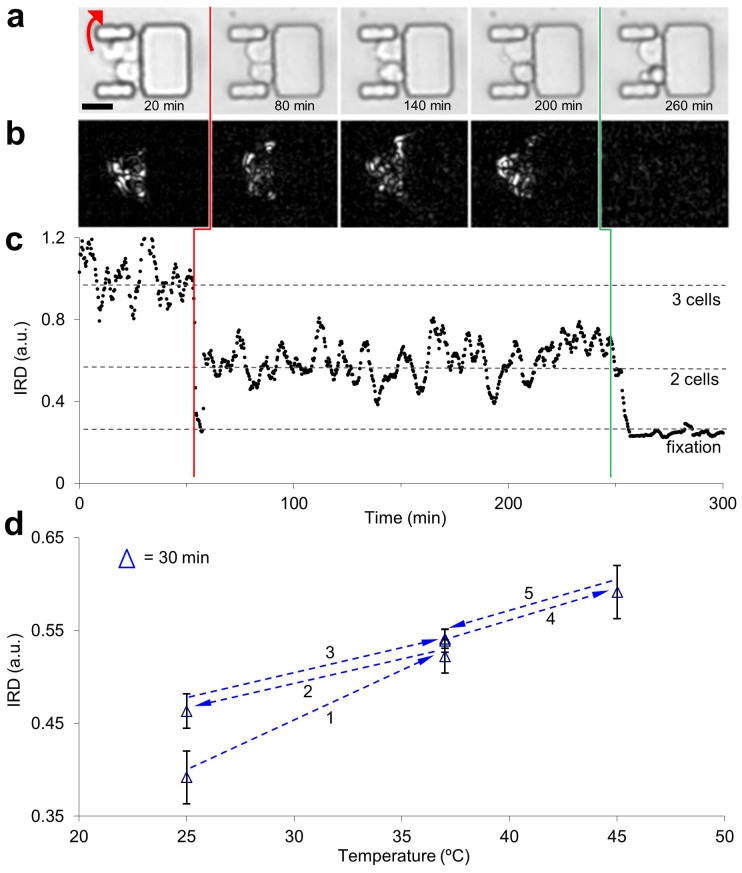
Figure 3. Non-translational cell motion within the MTNP in response to noxious stimuli and temperature variation.
(a) Bright field image montage of trapped Jurkat T cells exhibiting non-translational motion over time. One cell exits the trap at 54 min (red arrow in 20 min frame). Final frame shows remaining two cells fixated in media containing 2% formaldehyde after 15 min of exposure. Scale bar, 20 μm. (b) Visual representation of non-translational motion by the integrated rectified differences (IRD) corresponding to the images in (a), calculated as the difference between the sum of all pixel intensities of adjacent images. (c) Plot of IRD vs. time for the entire stack of images represented by the subset above. Each data point was taken 20 s apart. Cell exits trap at vertical red line. Green vertical line indicates perfusion switch to formaldehyde. (d) Average IRD of a randomly selected sample of 5 cells from a population of Jurkat cells in the MTNP at several temperatures. The progression through 3 distinct temperatures (25°C, 37°C, 45°C) at 6 different times is shown. After temperature stabilization, data were collected every minute for 32 min at each temperature. Plotted are the IRD data of all trap regions of the MTNP normalized to IRD data of all non-trap regions (cellular IRD normalized to non-cellular IRD). Error bars represent a range of one standard deviation for the 32 mean data points at each temperature.

