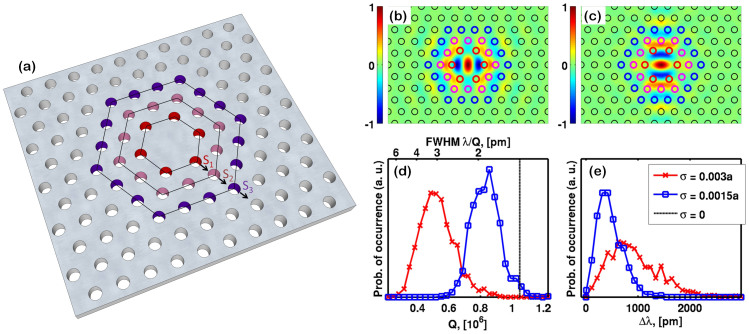
Figure 4.
(a): The design of the H1 cavity. The size of the first three hexagonal “rings” of holes is varied for quality factor optimization, with the increase of the distance from a hexagon vertex to the center of the cavity given by S1, S2 and S3 (marked). (b): Electric field (Ey) profile of the y-polarized and (c): electric field (Ex) profile of the x-polarized mode, for the optimal design S1 = 0.213a, S2 = 0.070a, S3 = −0.009a. (d): Histograms showing the probability of occurrence of different Qe-values for two different disorder magnitudes: σ = 0.003a (red) and σ = 0.0015a (blue). The black line indicates the ideal Qt. (e): Histograms showing the probability of occurrence of the wavelength splitting Δλ between the two modes, which are degenerate in the disorder-less cavity.

