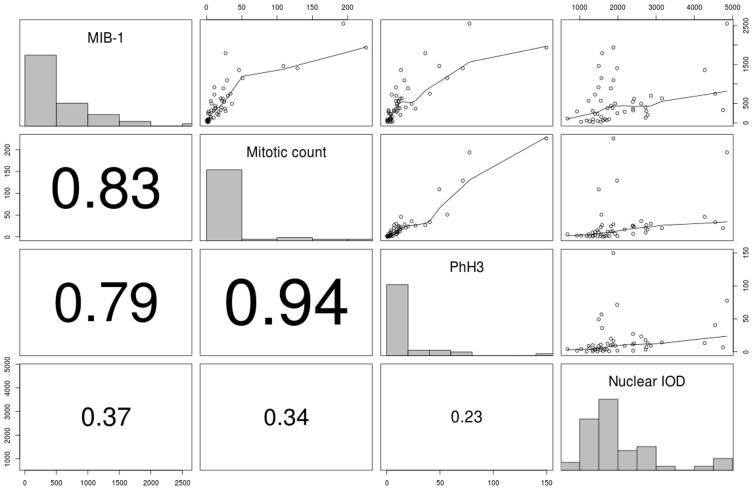
Figure 1. Scatterplot matrix for continuous variables (mitotic count, MIB-1, PhH3 and Nuclear IOD).
Variables are crossed against each other (upper right). In each scatterplot a black line illustrates average trend. The diagonal shows histogram of each variable. Correlation coefficients (Pearson) are found in lower left. The strongest correlation (0.94) is found between mitotic count and PhH3. The strongest correlation value involving nuclear IOD is 0.37 with MIB-1.

