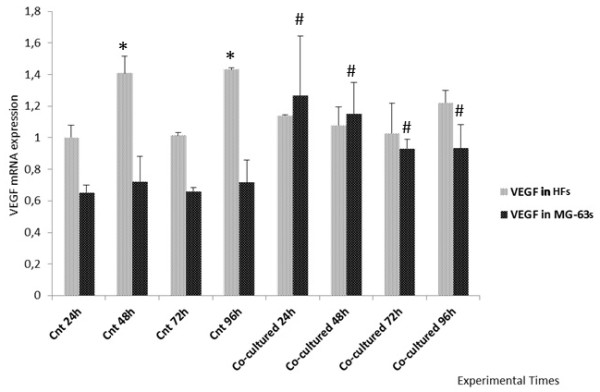
Figure 3.

Real Time PCR for VEGF. Expression of HFs and MG-63 cells independently grown and co-cultured. *represents a significant difference from the HF control sample at 24 h, P < 0.05. # represents a significant difference from the MG-63 control cells at 24 h, P < 0.05.
