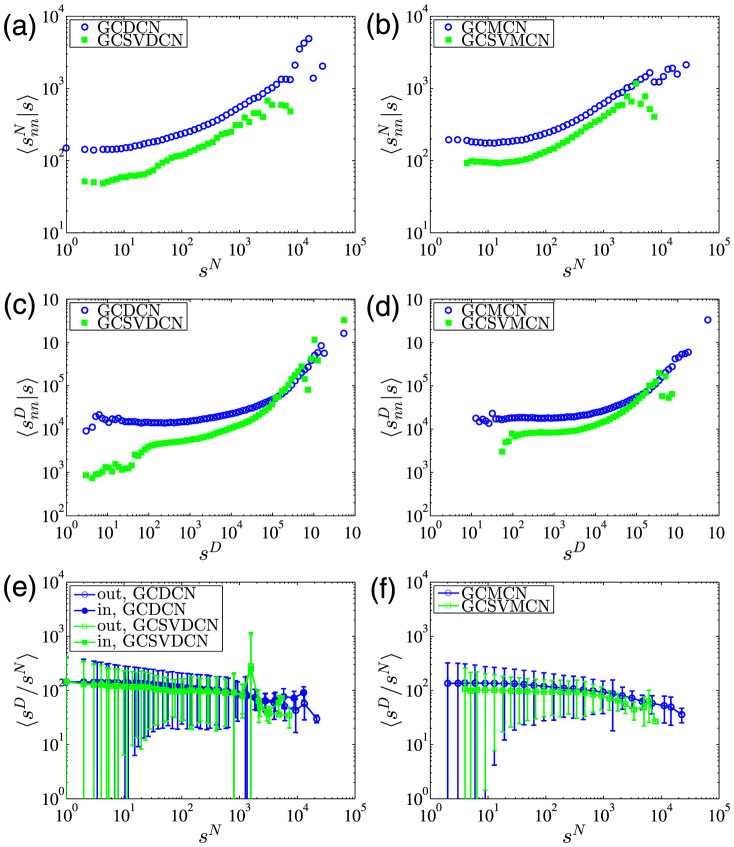
Figure 7. Node strength correlations.
(a) Average number-based node strength  as a function of sN for the GCDCN and the GCSVDCN. (b) Average number-based node strength
  as a function of sN for the GCMCN and the GCSVMCN. (c) Average duration-based node strength
  as a function of sD for the GCDCN and the GCSVDCN. (d) Average duration-based node strength
  as a function of sD for the GCMCN and the GCSVMCN. (e) Plot of 〈sD/sN〉 as a function of sN for the GCDCN and the GCSVDCN. (f) Plot of 〈sD/sN〉 as a function of sN for the GCMCN and the GCSVMCN.

