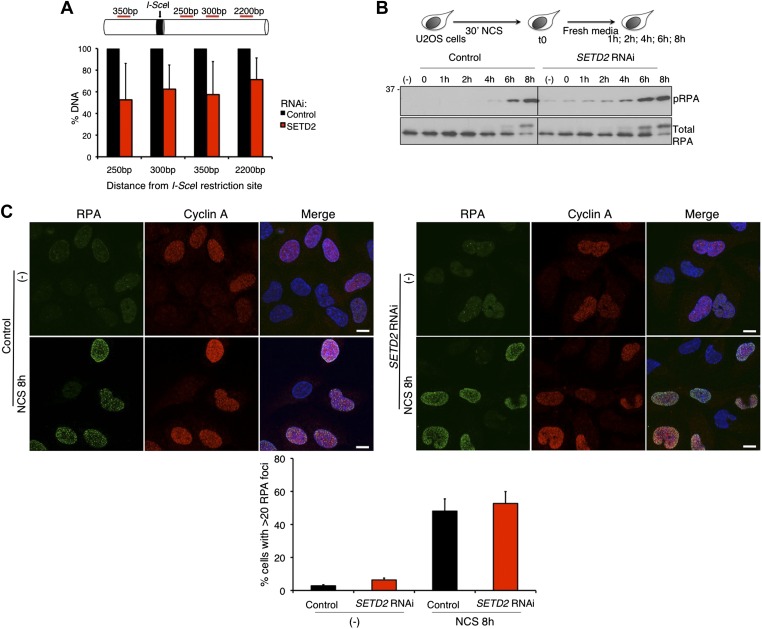
Figure 3. SETD2-independent DNA 5′ end resection and RPA recruitment to DSBs.
(A) Direct measurement of DNA 5′ end resection at the I-SceI site of the GFP gene in control and SETD2-depleted U2OS DR-GFP cells. The percentage of non-resected DNA at 250 bp, 300 bp, 350 bp, and 2200 bp from the I-SceI restriction site is shown. The percentage of DNA at each location was set to 100% in control cells. Means and standard deviations from five independent experiments using two distinct siRNAs targeting SETD2 are shown. (B) Control and SETD2 RNAi-depleted U2OS cells were challenged with NCS during 30 min and chased in fresh media during the indicated time points. Western blot analysis was performed with antibodies against pRPA and total RPA. Molecular weight markers (KDa) are shown on the left. (C) Immunofluorescence of control and SETD2 RNAi depleted U2OS cells before and 8 hr after NCS treatment was performed with antibodies against RPA and cyclin A. Dapi was added to the mounting medium to stain the DNA. Scale bars: 5 μm. The graph shows the percentage of cells with more than 20 RPA foci. A minimum of 400 cells on each of three independent experiments was scored.

