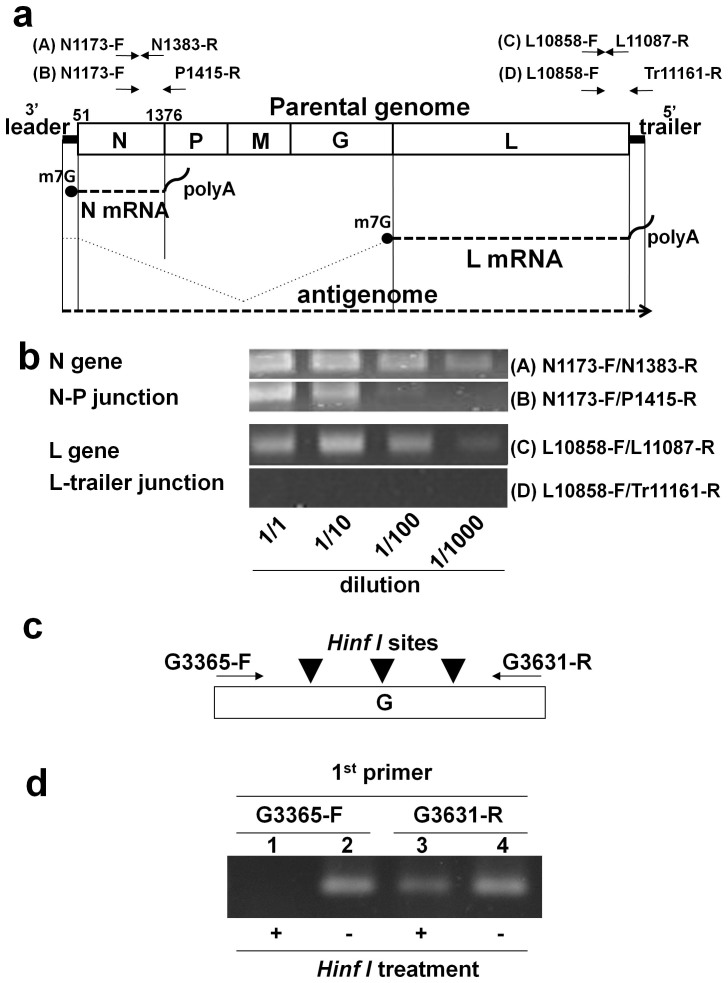
Figure 3. Structure and strand polarity of the VSV DNA and viral mRNAs.
(a) The PCR primers (A), (B), (C), and (D) are indicated above the diagram showing the VSV structure. The PCR primer pairs targeted (A) a region within the N gene (N1173-F/N1383-R), (B) a region spanning the N-P gene junction (N1173-F/P1415-R), (C) a region within the L gene (L10858-F/L11087-R), and (D) a region spanning the L gene-trailer junction (L10858-F/Tr11161-R). The N and L mRNA are shown schematically. (b) The DNA was extracted from 293T cells at 16 hr after infection with VSV at an MOI of 0.1 and subjected to PCR amplification. The cell lysates were diluted 1- to 1000-fold prior to PCR, and the PCR products were visualised using gel electrophoresis. (c) Unidirectional primer extension was performed using the positive-strand G3365-F primer or negative-strand G3631-R primer. After treatment with HinfI, the samples were subjected to PCR using the G3365-F/G3631-R primer pair. The three arrowheads indicate the positions of the HinfI restriction sites between the G3365-F and G3631-R primers. (d) The first and second lanes show the PCR results using G3365-F as the extension primer with and without HinfI treatment, respectively. The third and fourth lanes show the PCR results with and without HinfI treatment, respectively, using G3631-R as the extension primer. Note that cropped gel images, (b) and (d), are shown, and the gels shown in (b) were run under identical conditions.

