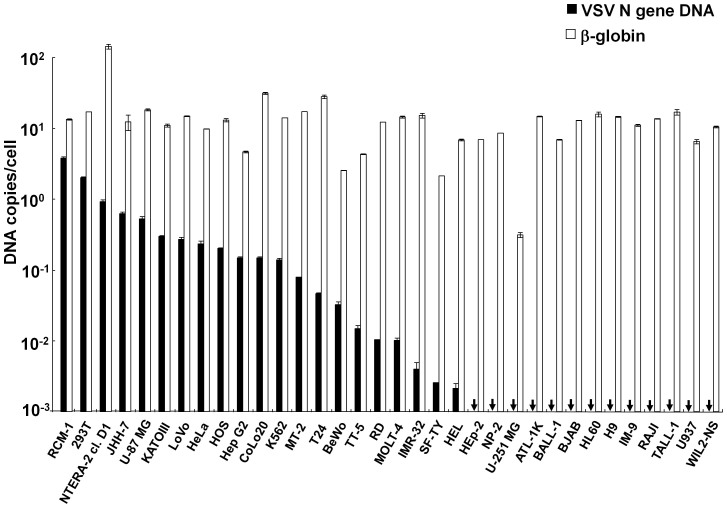
Figure 4. Cell-based differences in VSV DNA production.
Various human cells were infected with VSV at an MOI of 0.1. The DNA was extracted 16 hr later and subjected to PCR amplification. Real-time PCR was performed using the N478-F/N681-R or β-globin primer pair. The copy numbers of the VSV N and β-globin genes in each cell line are shown in closed and open bars, respectively. The arrows indicate that the copy number per cell was below the detection limit. The positive cells are ordered according to the VSV N DNA level, followed by the VSV DNA-negative adherent cells. Subsequently, the VSV DNA-negative suspension cells are arranged in alphabetical order. The means ± SE of two independent experiments performed in duplicate are shown.

