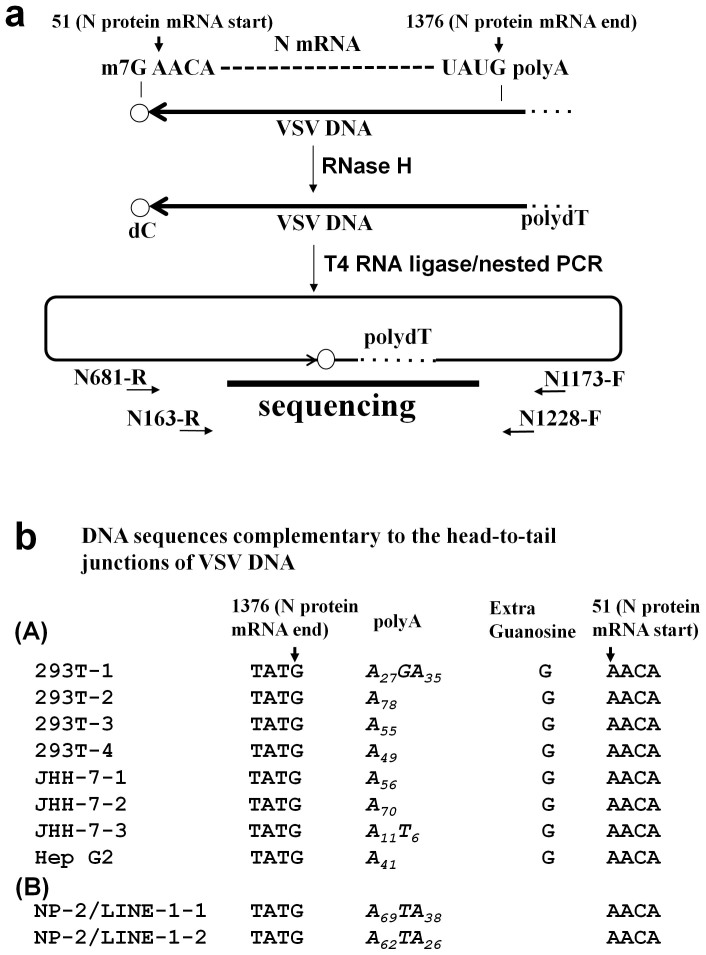
Figure 6. Sequence analysis of the 5′ and 3′ ends of the VSV DNA.
(a) Schematic diagram of the inverse PCR method used to amplify the 5′ and 3′ ends of the VSV DNA. According to the results shown in Fig. 3, we proposed that the VSV mRNA was reverse transcribed to DNA. The start (nucleotide 51) and end (nucleotide 1376) sites of the VSV N mRNA are indicated (GenBank: J02428.1). The cell lysates were treated with RNase H to digest the VSV RNA and then incubated with T4 RNA ligase to induce intra-molecular DNA end joining. The DNA was then amplified across the junction via nested PCR and sequenced. (b) The VSV DNA sequences of the head-to-tail junctions are shown. (A) VSV DNAs from four clones of 293T cells, three clones of JHH-7 cells, and one clone of Hep G2 cells are shown. All clones contained sequences corresponding to the 5′ end of the N mRNA (nt position 1376), followed by polyA tails consisting of 11 to 78 adenylate residues. (B) No additional G residue was found in two clones from the NP-2/LINE-1 (L1.2) cells infected with VSV.

