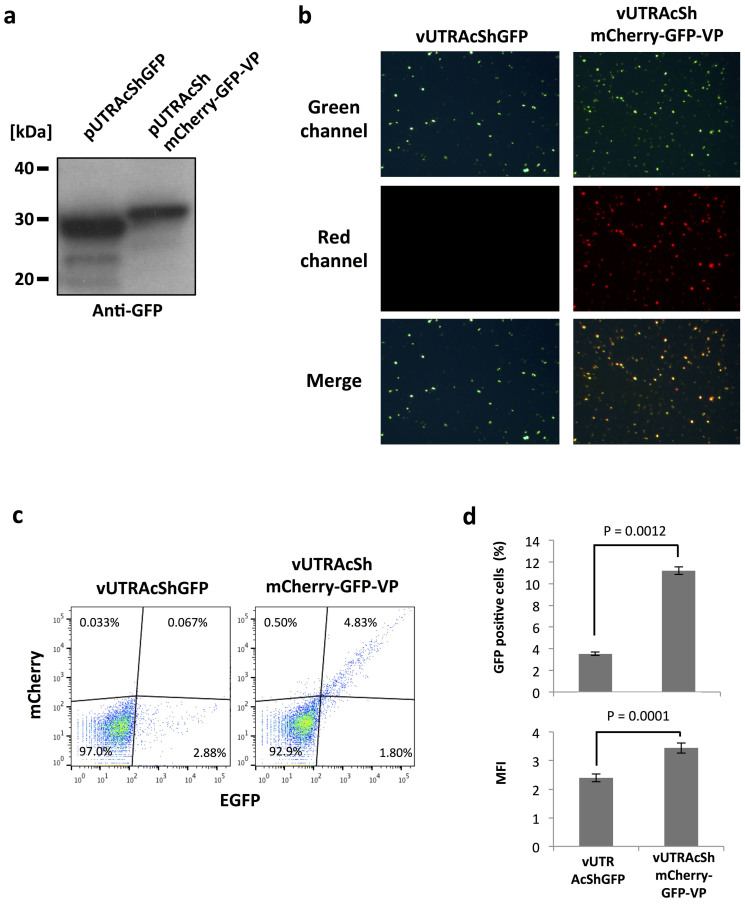
Figure 7. Multiple gene transduction by a polycistronic AgDNV vector in vitro.
(a) Western blot analysis of pUTRAcShGFP- and pUTRAcShmCherry-GFP-VP-transfected MOS55 cells with anti-GFP antibody. Samples were run on the same gel under identical conditions. Masses of protein size standards were indicated at left. Blot has been cropped; full uncropped blot with duplicates available as Supplementary Figure 1. MOS55 cells were infected with 5 × 10⁸ of each vUTRAcShGFP and vUTRAcShmCherry-GFP-VP. EGFP and mCherry expression was (b) visualized by fluorescence microscopy and (c) quantified by flow cytometry analysis. (d) The rate of EGFP positive cells (upper panel) and MFI (lower panel) was quantified by flow cytometry. Mean and S.D. were calculated from three independent infections. P-values were determined by Student's T test.

