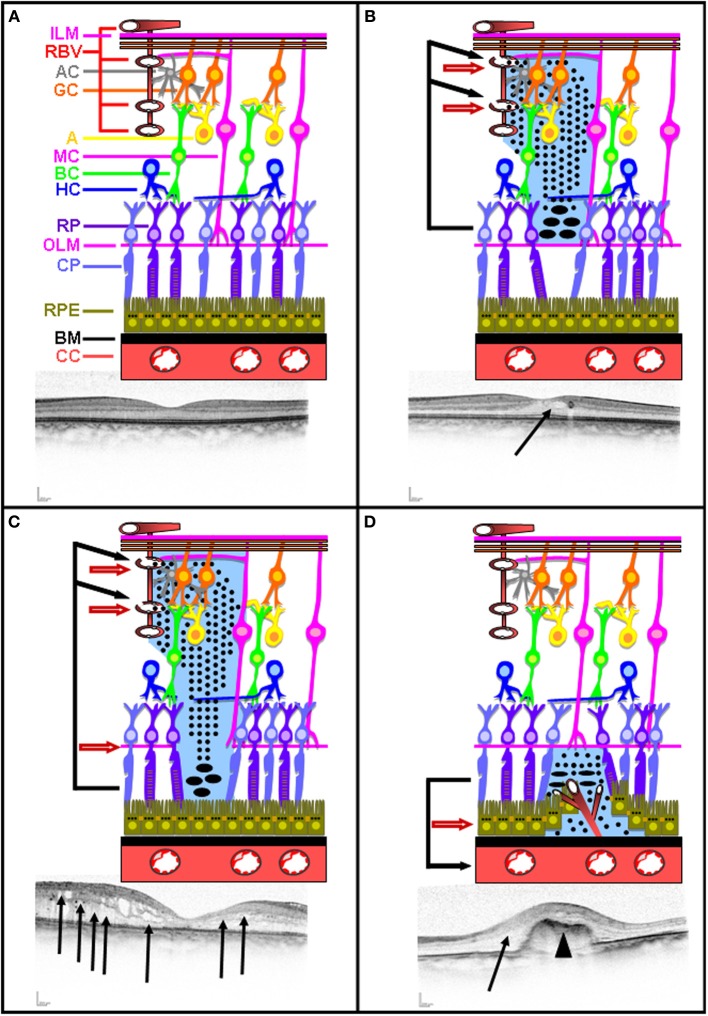
Figure 3.
Intact and disrupted BRB. Schematic representation of intact inner and outer BRB representation illustrated with a corresponding OCT picture (A). Schematic representation of inner BRB rupture without concomitant OLM rupture illustrated with a corresponding OCT picture (B). Schematic representation of inner BRB rupture with concomitant OLM rupture illustrated with a corresponding OCT picture (C). Schematic representation of outer BRB rupture following neovascularization occurring in AMD illustrated with a corresponding OCT picture (D). Plain arrow indicates edema. Arrow head indicates neovascularization.

