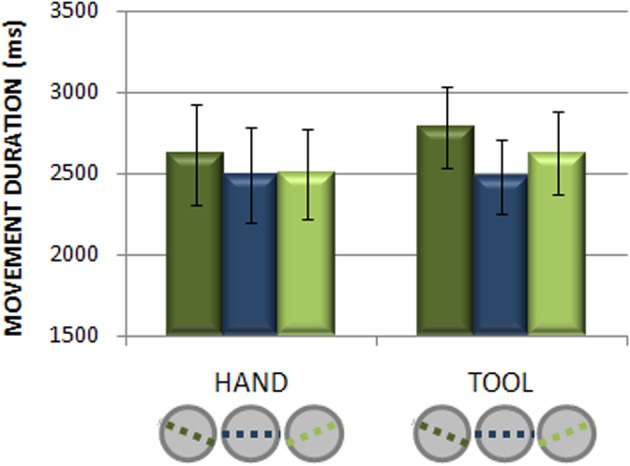
Figure 3.

Imagined movement duration. The graph displays the average imagined movement duration as a function of effector (hand and tool) and orientation of the Opposition Axis (−22°; 0°; +22°). Bar graphs illustrate mean values for each parameter ±1 s.e.m.
