
Fig. 2.
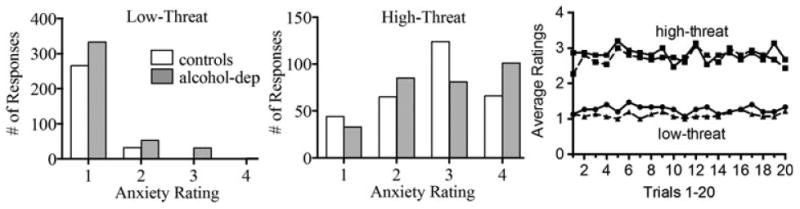
Distribution of anxiety ratings to low (left panel)- and high (middle panel)-threat conditioned stimulus in healthy control and alcohol-dependent participants. The right panel shows group mean high- and low-threat ratings over the 20 trials for control (dashed line) and alcohol-dependent (solid line) participants.