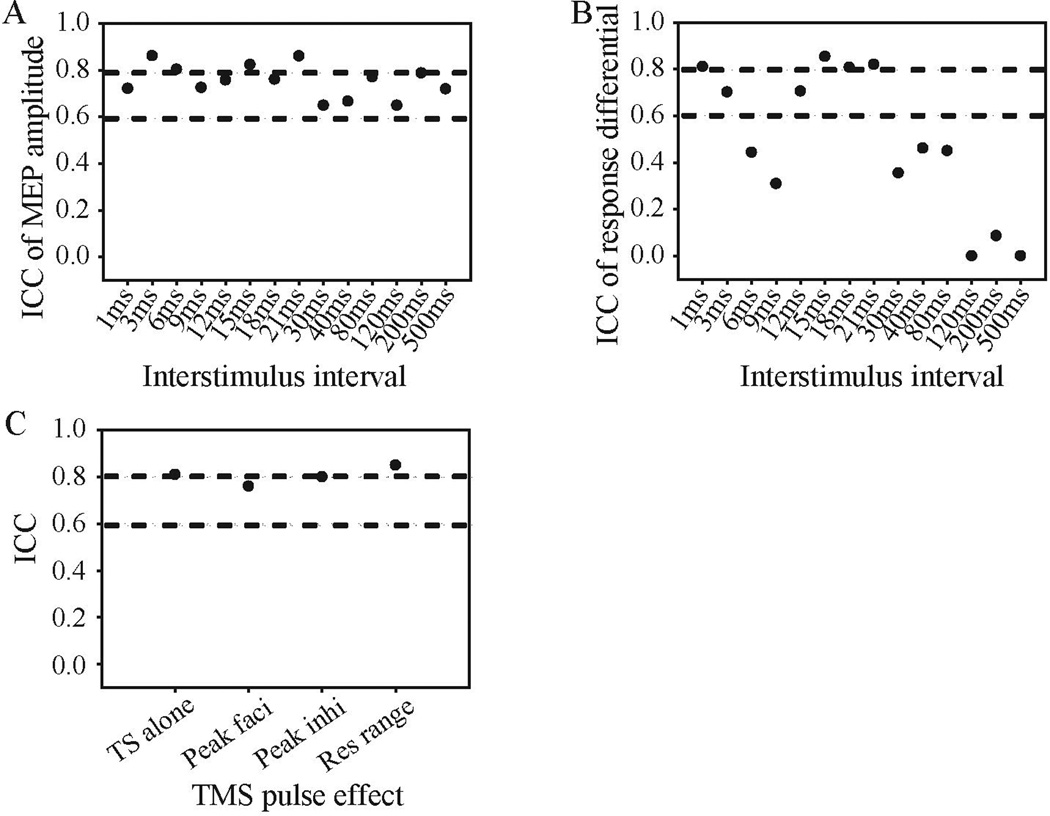
FIGURE 4.
Intraclass correlation coefficients (ICCs) of ppTMS effects. ICC of ppTMS effects was shown in raw MEP amplitudes (A) and response differential (B). Panel C shows the ICCs for single test stimulus (TS alone), peak facilitation (peak faci), peak inhibition (peak inhi) and response range (res range). All negative ICCs were set to zero for presentation purpose. The lower and upper dash lines indicate ICC of 0.6 and 0.8, respectively, indicating thresholds for acceptable vs. good reliability, respectively.

